Project aim
Quantify how much of Obuasi Municipal District lost vegetation between 2018 and 2024, and where that loss is concentrated.
- 32.0%District in decline
- 9.2%Strong decline
- 22.8%Moderate decline
- 7 yrsTime series
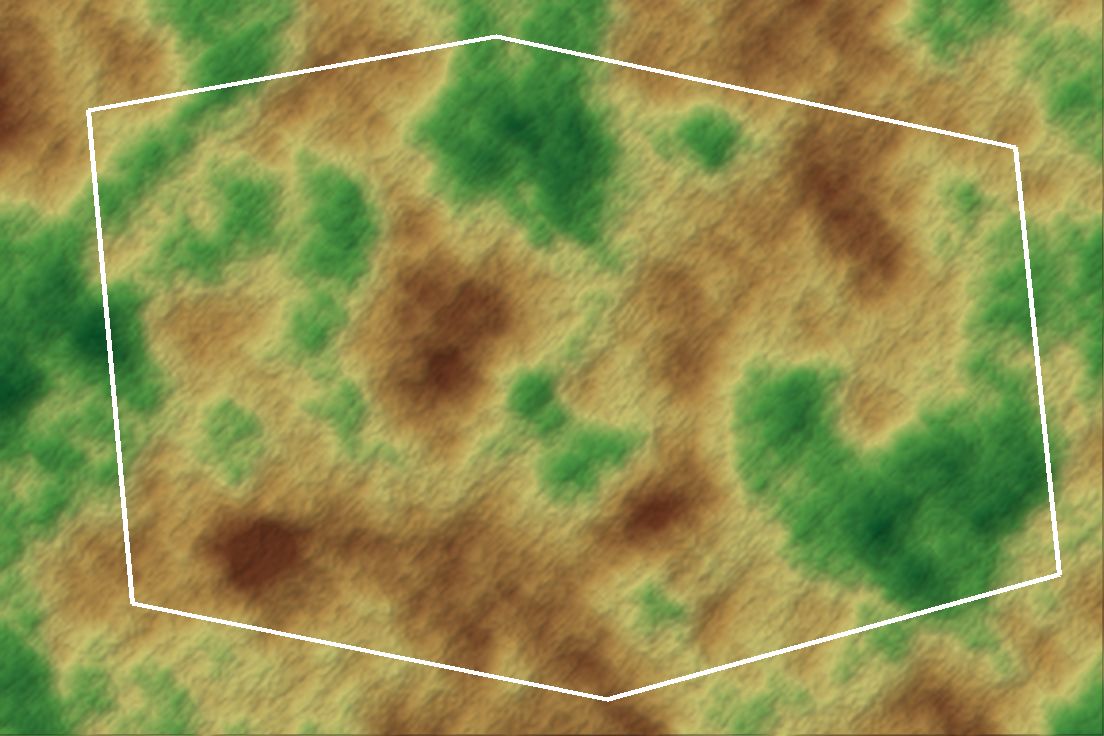 Illustrative graphic
Overview
Built end-to-end with pygeofetch, this case study analyses a boundary-clipped USGS Landsat NDVI time series for 2018 to 2024. It finds 32.0% of the district in measurable vegetation decline (9.2% strong and 22.8% moderate), spatially concentrated around mining activity.
The challenge
Year-to-year NDVI varies with rainfall and acquisition dates, so single-image comparisons exaggerate or hide change. A trend over the full series, clipped to the official district boundary, gives a figure local stakeholders can use.
Data & inputs
Approach
-
01
Data acquisition
USGS Landsat scenes for 2018 to 2024 were searched and downloaded with pygeofetch.
-
02
Boundary clipping
All rasters were clipped to the Obuasi Municipal District boundary.
-
03
NDVI time series
NDVI was computed for each scene and assembled into a per-pixel time series.
-
04
Trend classification
Per-pixel trends were classified into strong decline, moderate decline and stable or increasing.
Results
32.0% of the district shows measurable vegetation decline, spatially concentrated around mining activity.
Validation
Reproducible notebook using public Landsat data.